GE scales are a scam and math theater
I exported 3 months of readings from my GE CS10H smart scale. The body fat percentage comes from a formula: fat % = 0.434 × weight − 17.5. Every one of 37 readings fits within 0.1 points.
How I caught it
The scale syncs to an app called Fit Profile. The app exports to xlsx. I exported 40 weigh-ins from June to August 2026 and ran a linear regression of body fat % against weight.
- 37 readings with a body fat number, 3 with none
- Correlation between weight and fat %: 0.998
- Residual standard deviation: 0.04 points
- Worst deviation from the formula: 0.09 points, within display rounding
Real bioimpedance jitters. Hydration, meals, time of day, and wet feet move the reading 0.5 to 1.5 points at the same weight. Zero jitter means zero measurement.
Same weight, same fat, months apart
The clearest tell needs no statistics. Repeat a weight, and the fat % repeats exactly:
- 89.05 kg on Jun 16, Aug 5, and Aug 8: 21.2% all 3 times
- 88.55 kg on Jun 12 and twice on Jun 22: 21.0% all 3 times
Between those dates I lost and regained real weight. My body in mid June and my body in early August produced the identical number, because the only input is the weight.
The socks test
Bioimpedance needs skin contact. Electrodes push a small current through your body and measure resistance. The CS10H's own instructions require bare feet, with both hands and feet touching the electrodes.
This scale prints the same numbers with socks on. The whole case in one sentence. Not even my feet sweat enough to turn socks into copper electrodes.
A Reddit commenter identified an important caveat: the handle might still complete a hand-to-hand impedance circuit, or the app might reuse a stored value. I found no documentation for the stored-value theory. Either way, insulated feet cannot produce a fresh 8-electrode measurement of both legs. The socks test is suspicious, but the formula and height test are the stronger evidence.
The height test
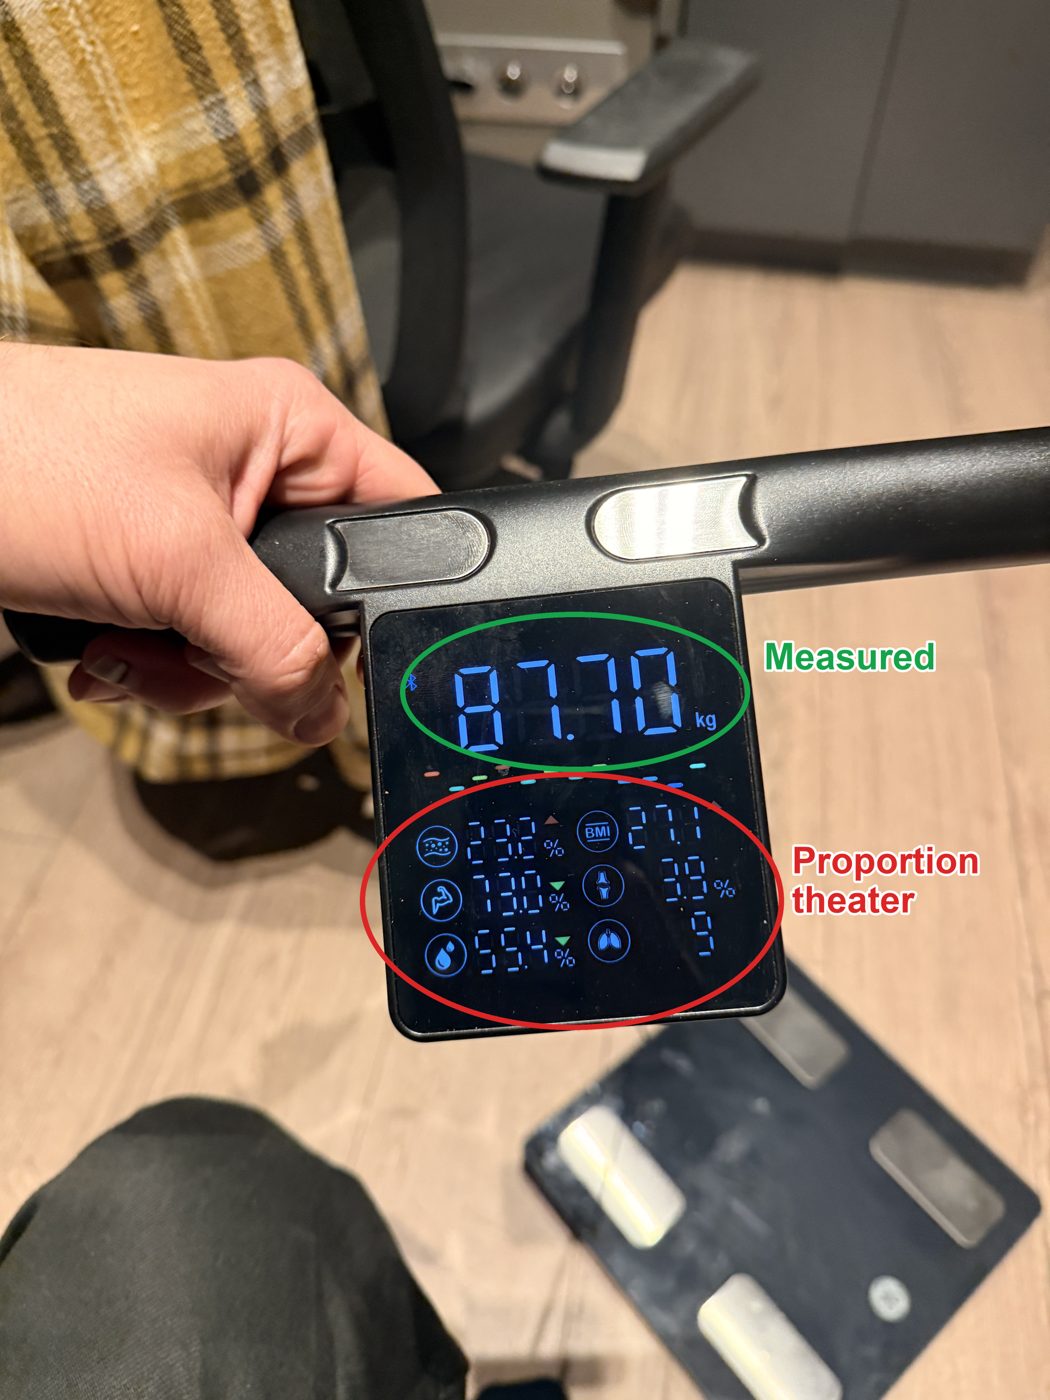
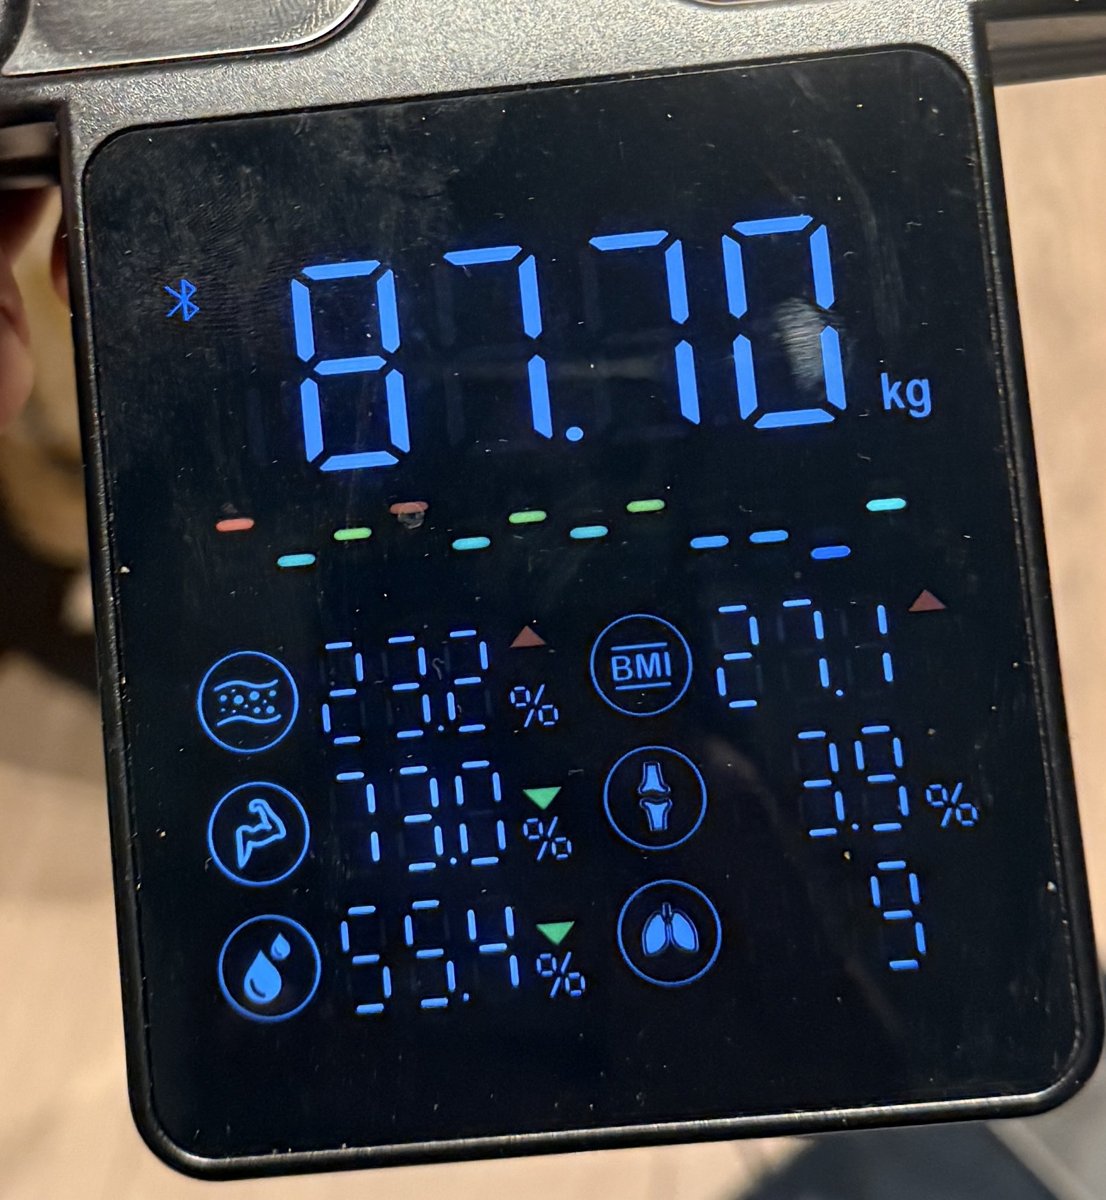
Second experiment, also 2 minutes. I changed my height in the app from 1.86 m to 1.80 m and stepped on again. Same body, same evening. The scale printed 87.70 kg, BMI 27.1, body fat 23.2%, water 55.4%.
Losing 6 cm of height on paper added 2.6 points of body fat. That unlocks the full formula. Rewrite my weight regression in BMI terms and it predicts fat 23.2% and water 55.5% for exactly this weigh-in. The scale runs on:
- fat % = 1.5 × BMI − 17.5
- water % = 84 − 1.06 × BMI
A $30 pocket calculator with a BMI chart taped to it, sold as a 6-electrode body composition analyzer.
A second owner replicated it
A Reddit user who owns the same GE CS10H ran an independent replication. They are 6′8″ tall and plotted 4 readings. Their body-fat output was also an almost perfect straight line against BMI: R² = 0.9992.
I digitized the 4 points from their chart. They follow the same 1.5 × BMI formula as mine, but their line sits 0.95 percentage point lower:
- My 37 readings: fat % = 1.50 × BMI − 17.50
- Their 4 readings: fat % = 1.50 × BMI − 18.45
- Their mean error: 0.025 percentage point
- Their worst error: 0.05 point
The shared slope suggests the app uses the same BMI calculation and adds a profile-dependent constant for sex, age, mode, or another setting. The second owner did not reproduce my exact intercept. They reproduced the arithmetic.
One more touch. The scale plays a "measuring" animation for several seconds before showing these numbers. The arithmetic takes microseconds. The wait sells the theater.
The hardware could do it
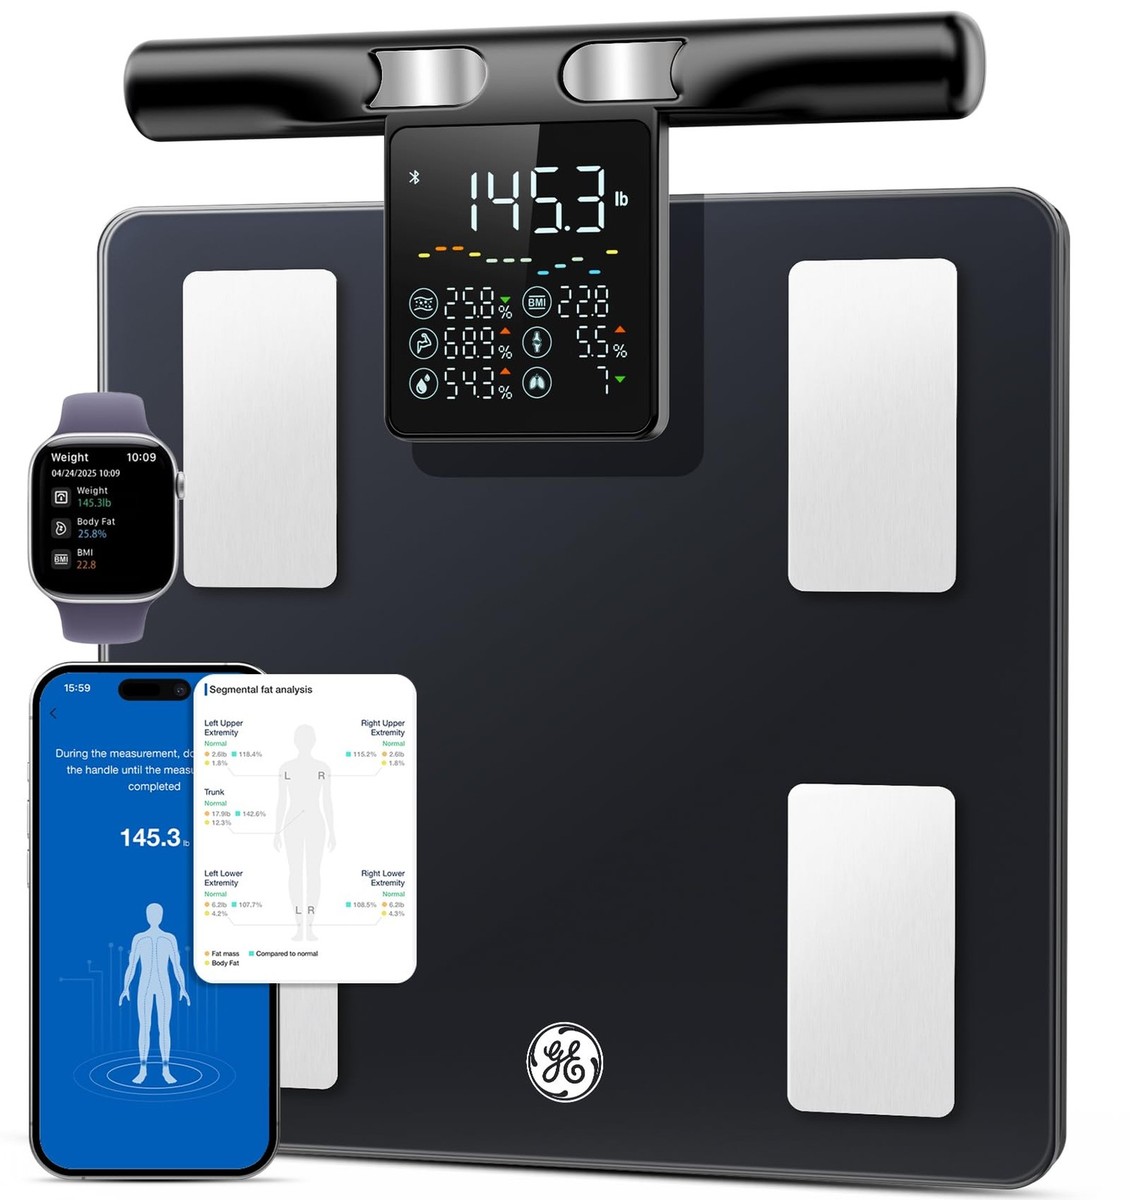
The CS10H has 6 electrodes, including a pull-out handle. The listing promises 8: an "8-Electrode Body Pod Fat Monitor with Full Body Composition Analysis". Hand plus foot electrodes are exactly the hardware real segmental bioimpedance uses.
The app duly reports per-limb muscle and fat, protein, bone mass, body water, visceral fat, and metabolic age. Every one of them tracks weight perfectly. Body water in my export is a mirror of the fat curve. The hardware ships, the impedance signal does not meaningfully change the output; the formula prints.
The app doubles down
The Fit Profile app expands the one measured number into an "In-depth Report". These screens correspond to my 85.65 kg weigh-in. Body fat 19.7%. The formula says 19.69.
- Segmental fat analysis per limb: right arm 1.08 kg of fat, left arm 1.04 kg. Fake precision down to 40 grams, while the headline result follows a BMI formula.
- Muscle balance: left leg 103.7% of normal, right leg 104.3%.
- Metabolic age 46, waist-to-hip ratio 0.96, protein 18.2%, BMR 1855 kcal: an entire clinical report from one load cell and a profile form.
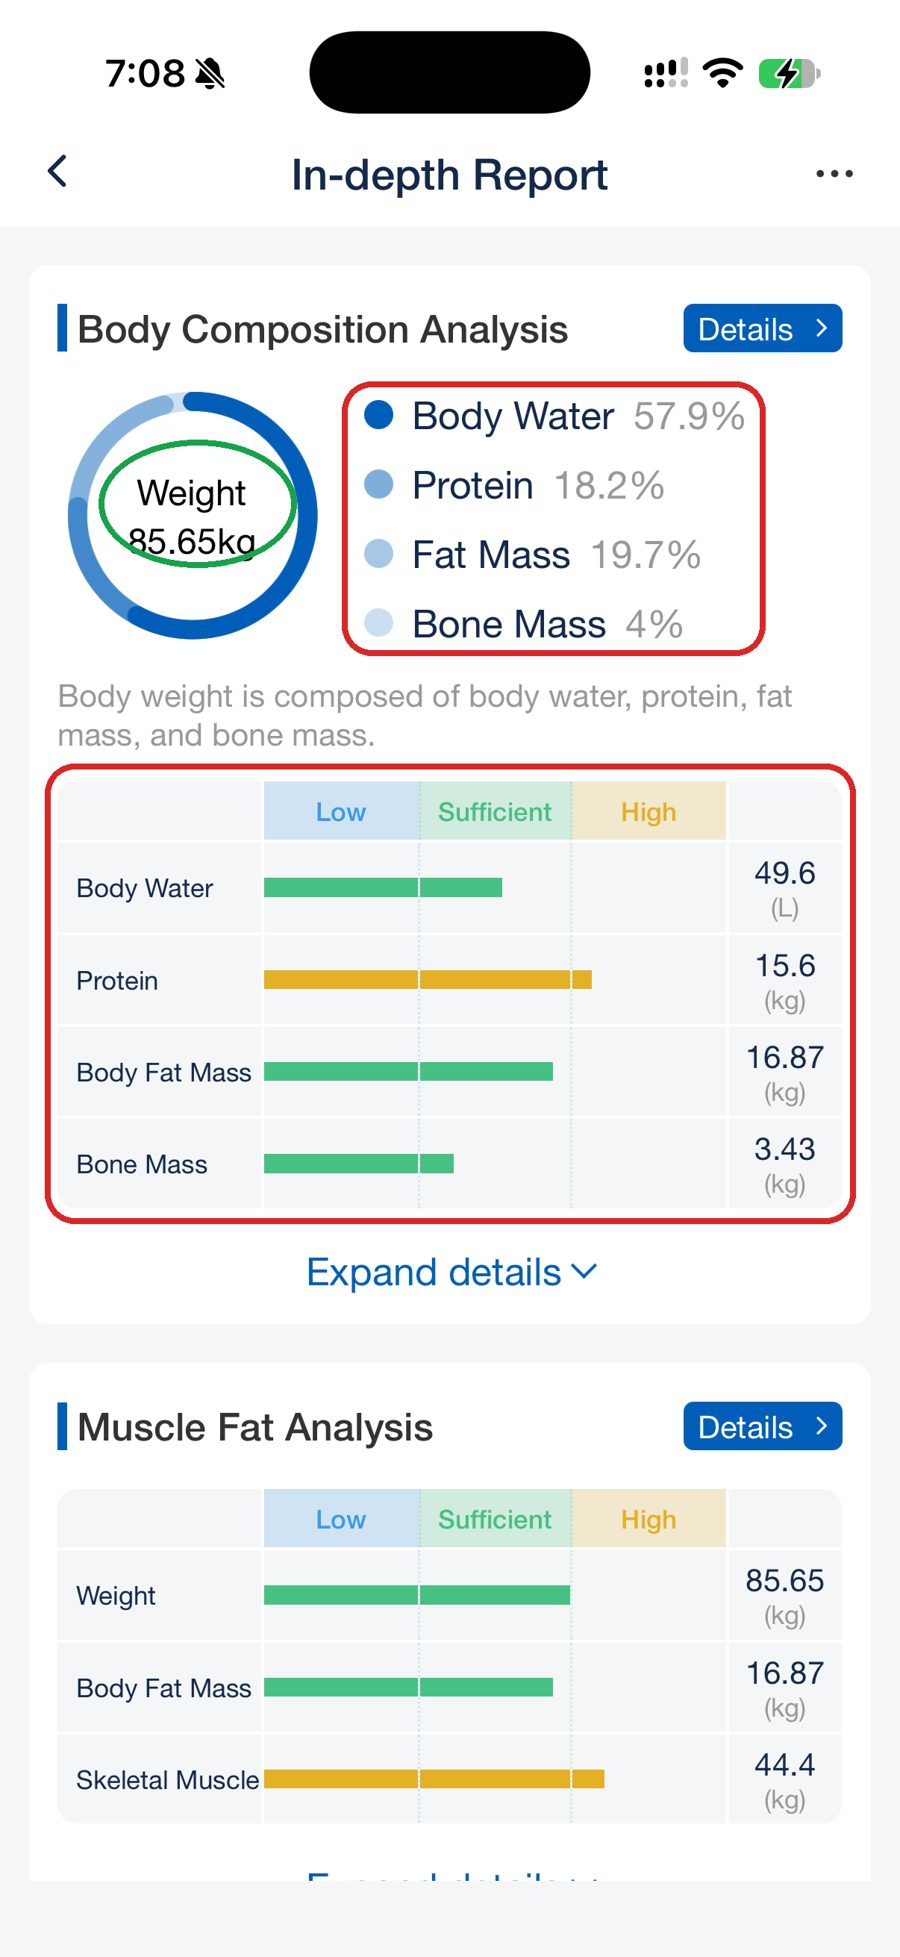
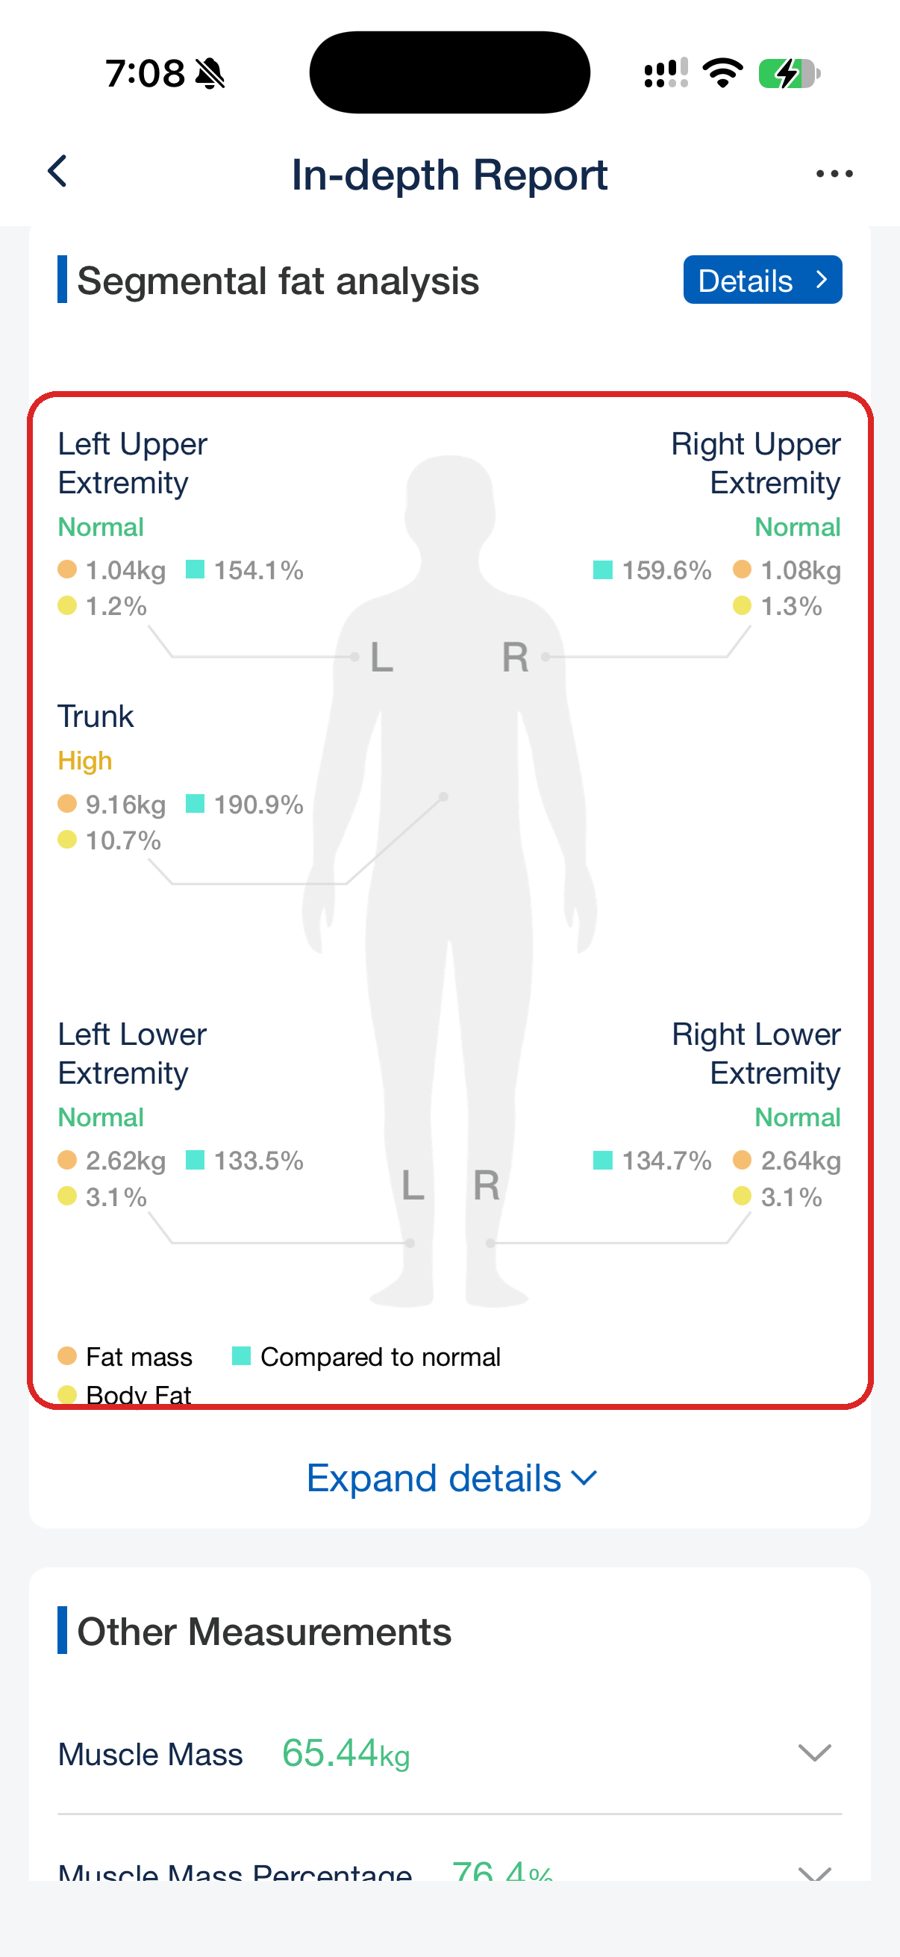
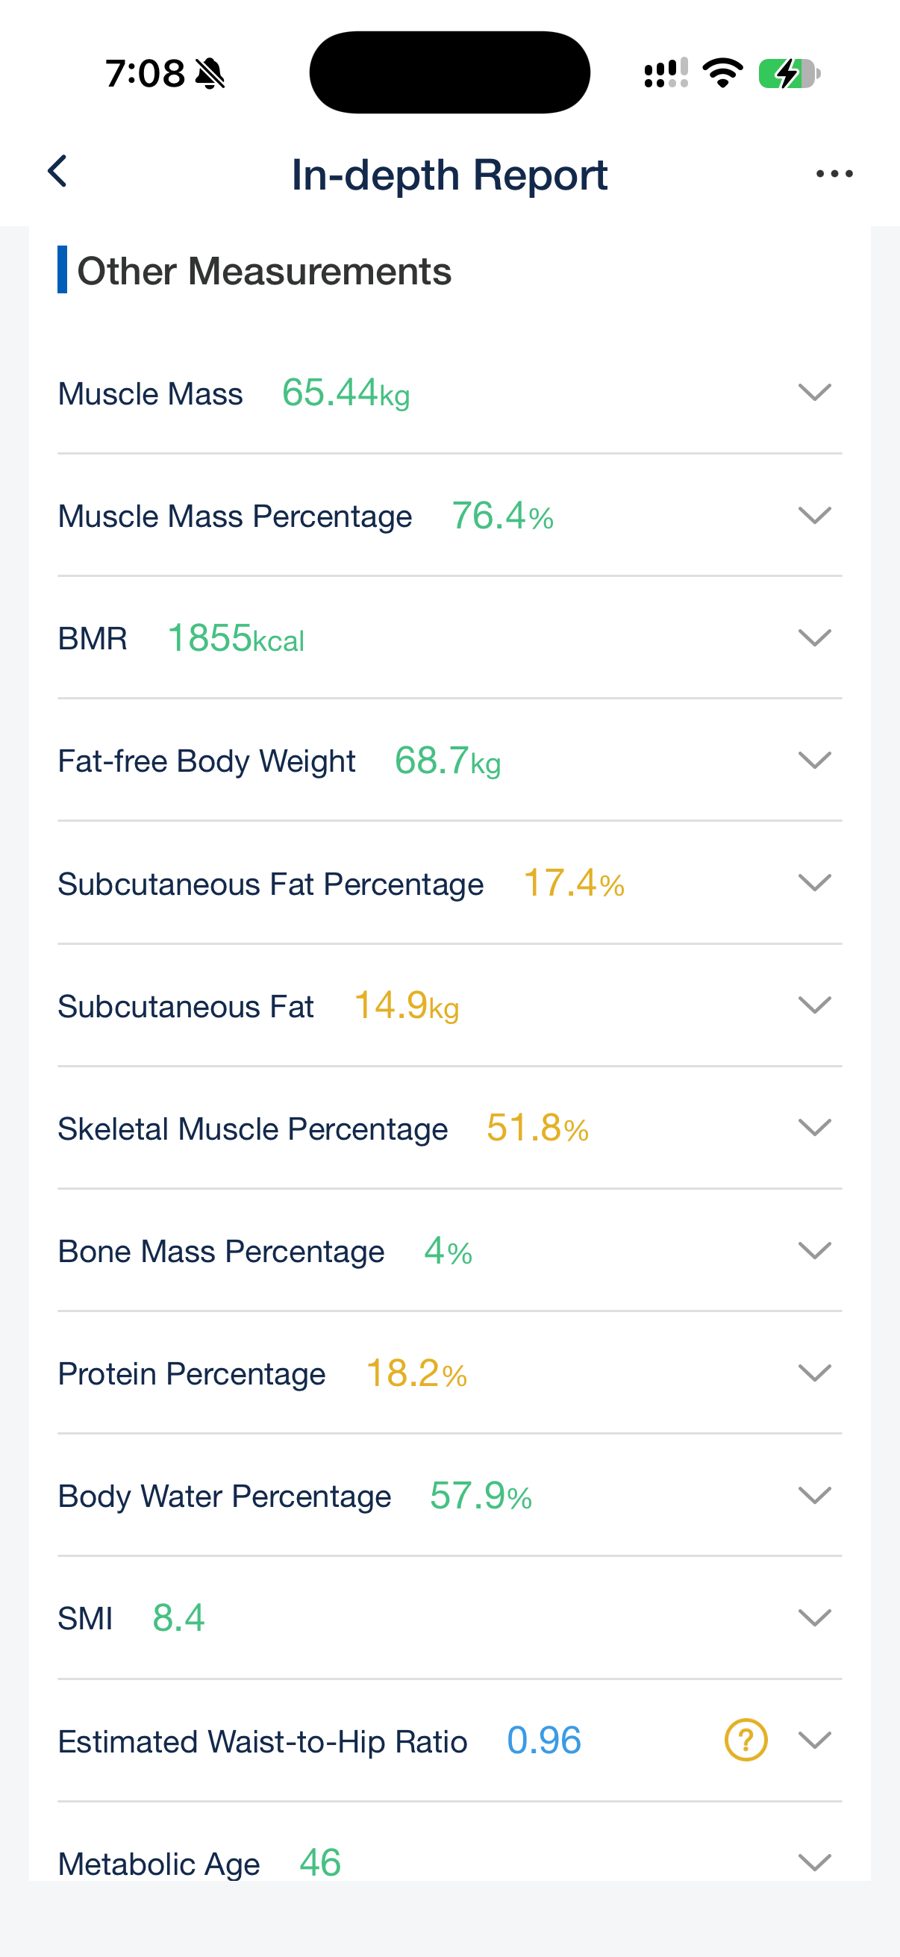
Green: measured. Red: computed. The third screen has no green anywhere.
Who actually makes it
The GE brand is licensed. The Fit Profile app is published by Global eFit Incorporated, which sells "GE branded scales" at fit-profile.com. The GE monogram on the glass is the most expensive component of the product.
There is precedent. The SEC fined GE $50 million in 2009 over its accounting and $200 million in 2020 over its disclosures. The licensed scale keeps the family tradition: confident numbers with no measurement behind them. The biggest cooked books GE has shipped since, and this time they weigh you back.
What works
- The load cell is fine. Weight readings are consistent and tracked my real 5.8 kg loss over 5 weeks.
- The electrodes physically exist, and the contact detection works. Skip the handle, or hold it with 1 arm, and the scale refuses to show body composition. It enforces the ritual, then produces the same formulaic result.
- Bluetooth sync works.
- The app exports clean xlsx. That export is how it got caught.
The joke is on me
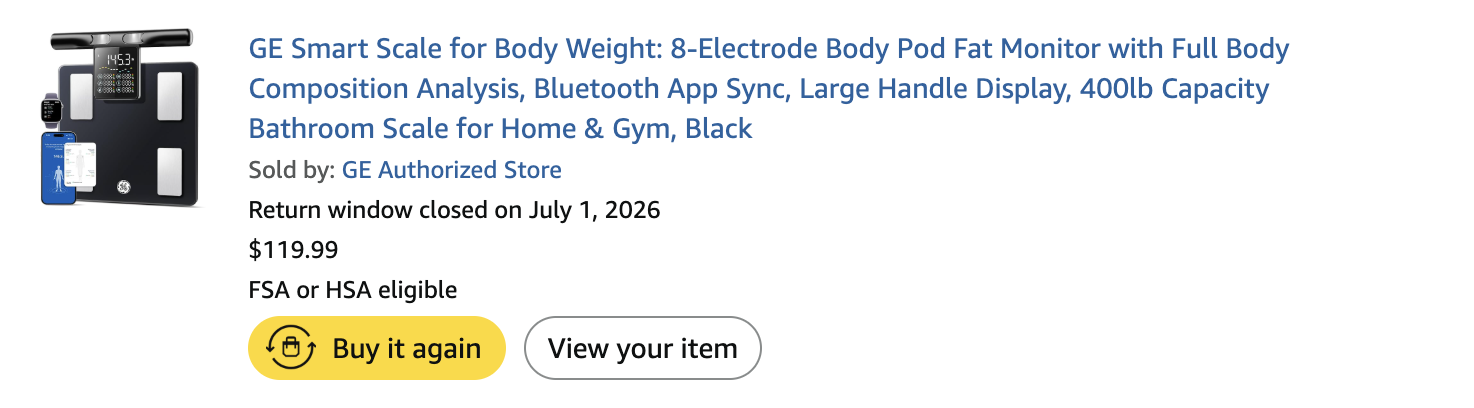
Amazon sells $10 and $20 body composition scales by the pallet. I skipped them all and paid $119.99 for the brand name. The brand name skips the measurement. Amazon also flags it FSA and HSA eligible, so Americans can buy this formula with pre-tax health money.
Test your own scale
Takes 10 minutes, no lab needed:
- Export your history from the companion app. Most export csv or xlsx.
- Plot body fat % against weight. A straight line with no scatter is a formula.
- Find 2 days with the same weight, weeks apart. Identical fat % is a formula.
- Create a fresh profile and take its first reading in socks. Full segmental results cannot come from a stored earlier measurement.
- Change your height in the app and step on again. A different fat % on the same body means the number comes from your profile settings.
Verdict
Buy it as a weight scale, if the price says weight scale. Ignore every other number on the screen. And if your smart scale never surprises you, it runs a spreadsheet.
Data and method
- Data: 40 readings exported from the Fit Profile app, Jun 1 to Aug 27, 2026. Download: all 40 readings, csv, minus the device MAC.
- Regression: fat % = 0.4342 × weight − 17.498. r = 0.998, residual SD 0.04 points, worst deviation 0.09.
- Height experiment, Aug 27: profile set to 1.80 m, weight 87.70 kg. Displayed fat 23.2% and water 55.4%. BMI-formula predictions: 23.16 and 55.45.
- Independent replication: 4 points digitized from the reviewer's chart. Download: peer-review data, csv.
Discuss: Reddit